Trace GitHub Actions jobs with OpenTelemetry and RunsOn
Trace a GitHub Actions job from webhook to test with RunsOn and otel-cli. In our demo, a 15-second test step ran 0.3 seconds of tests.
 Cyril Rohr
 A slow GitHub Actions job has two clocks: the time before the first step, and the time inside your steps. GitHub shows you the second one step at a time, and a step called Run tests is a single number however much work hides inside it.
We built OpenTelemetry support into RunsOn to see both. Here is one real job, traced end to end: 35 seconds passed between the webhook and the first step, and a 15-second Run tests step spent 0.3 seconds running tests.
Before the first step#
For this post, I ran a small Python test suite, with one Postgres integration test, on our staging Flex stack and sent everything to SigNoz.
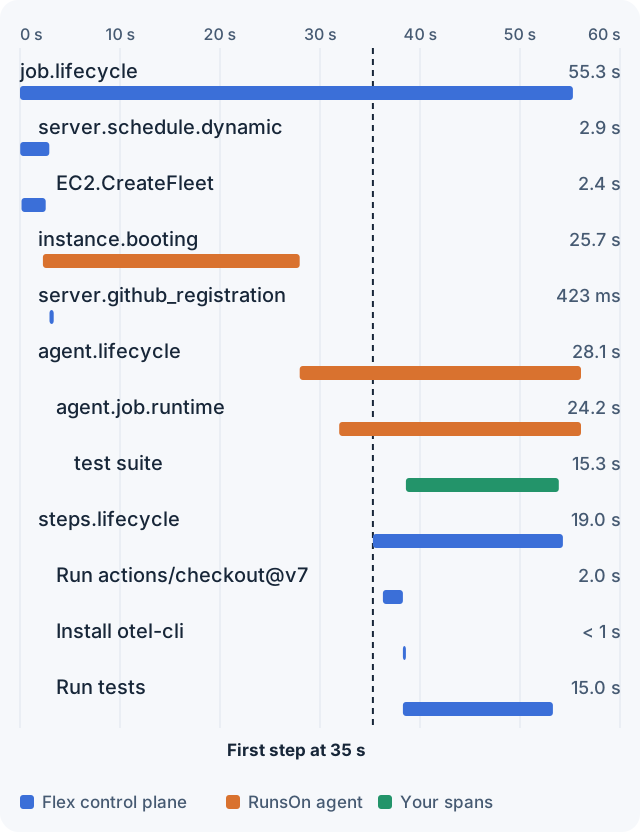
The first step started 35 seconds after the workflow_job webhook. Scheduling took 2.9 seconds, 2.4 of them in EC2.CreateFleet. The instance then booted for 25.7 seconds before the RunsOn agent started, and the agent took another 7 seconds to get the runner to its first step. GitHub registration, at 0.4 seconds, happened while the instance booted.
That breakdown tells you what to fix. A slow CreateFleet points at capacity or Spot availability, a long boot at the image and its volume, a slow agent at setup work. Boot time also varies: in an earlier run of this demo it took 16 seconds. When those seconds matter, a warm pool removes most of them.
George Sims’s CNCF article on CI tracing ↗ turns GitHub’s webhook events into workflow, job, and step spans, so you can see how long a job queued. It can’t see why. Only the system that launches the runner knows where the queue time went, so RunsOn reports it.
GitHub steps become spans automatically#
On Flex, the step names you already know appear in the same trace without changing the workflow. RunsOn emits them after the job completes, from the step timings GitHub reports. They need the control plane’s OTLP exporter, not extras=otel on the job.
Step spans answer “which step?” They can’t answer “what inside the step?”: the demo’s Run tests span says 15 seconds and nothing else. GitHub also reports step times in whole seconds, so short steps show up as zero.
Automatic step spans are specific to Flex. Fleet’s control plane exports metrics, logs, and AWS API call spans, but no job or step spans, and a Fleet runner’s trace is not linked to the control plane.
Go inside a step#
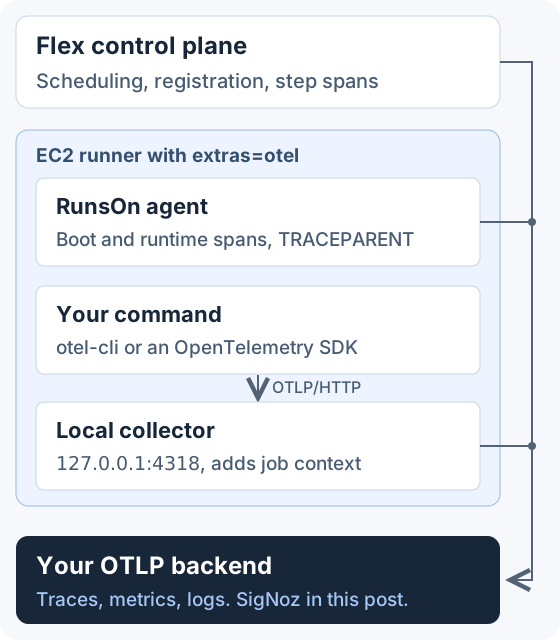
With extras=otel, every runner starts a local OpenTelemetry collector on 127.0.0.1:4318, on Flex and Fleet from v3.2.1. Programs on the runner send it OTLP over HTTP; the collector adds runner and job attributes and forwards everything to the backend configured on the stack. The RunsOn agent exports its own spans directly, and sets TRACEPARENT so your spans join the job’s trace.
For shell commands, otel-cli ↗ is the smallest way to start. The demo wraps the test step in one span, and each phase in a child span:
- name: Install otel-cli  run: |    mkdir -p "${RUNNER_TEMP}/bin"    curl -fsSL https://github.com/equinix-labs/otel-cli/releases/download/v0.4.5/otel-cli_0.4.5_linux_amd64.tar.gz \      | tar -xz -C "${RUNNER_TEMP}/bin" otel-cli    echo "${RUNNER_TEMP}/bin" >> "${GITHUB_PATH}"
- name: Run tests env: OTEL_EXPORTER_OTLP_ENDPOINT: http://127.0.0.1:4318 OTEL_EXPORTER_OTLP_PROTOCOL: http/protobuf OTEL_EXPORTER_OTLP_BLOCKING: "true" OTEL_CLI_FAIL: "true" run: | otel-cli exec --service ci-tests --name "test suite" --tp-required \ -- ./ci/test.sh#!/usr/bin/env bashset -euo pipefail
span() { otel-cli exec --service ci-tests --name "$1" -- "${@:2}"; }
span "start postgres" ./ci/start-postgres.shspan "unit tests" python3 -m unittest discover -s tests/unitspan "integration tests" python3 -m unittest discover -s tests/integrationotel-cli exec passes its span’s context to the command it runs, so each nested call becomes a child span. start-postgres.sh uses the same helper around pull image and wait for ready. --tp-required turns a missing TRACEPARENT into an error instead of silently starting a separate trace, and OTEL_CLI_FAIL surfaces exporter errors.
Install the prebuilt binary. An earlier version of this demo used go install, which took 31 seconds: the trace’s first finding was our own setup.
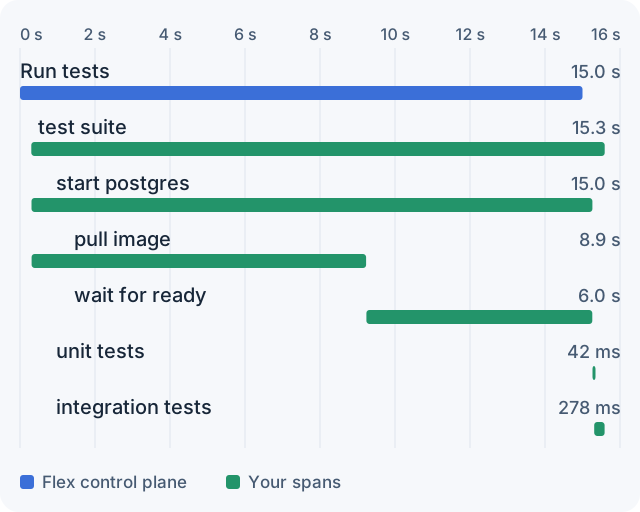
Run tests step: 0.3 seconds of tests.The tests took 0.32 seconds: 42 ms of unit tests and 278 ms of integration tests. Everything else went to Postgres: 8.9 seconds pulling the image and 6.0 seconds waiting for it to accept connections. That isn’t a test problem, and a test profiler would never have shown it. Baking the image into a custom AMI removes the pull; the readiness wait is the database’s own startup.
Your spans sit under the agent’s agent.job.runtime span, next to the step spans rather than under Run tests. RunsOn rebuilds step spans from GitHub’s timings after the job ends, so your spans can’t be nested under them. They share the trace and the timeline, which is what you read.
There is no final wait step. OTEL_EXPORTER_OTLP_BLOCKING only waits until the local collector accepts a span, and the collector batches for up to 10 seconds. On Flex, RunsOn stops the collector cleanly when the job ends, which sends that last batch: the demo’s final spans ended about a second before the job did and still arrived. On Fleet, the instance can be terminated before that shutdown completes, so for now end Fleet jobs that send telemetry with sleep 15.
Connect your backend once#
Point the stack’s OTLP exporter at your backend: OtelExporterEndpoint and OtelExporterHeaders on CloudFormation, otel_exporter_endpoint and otel_exporter_headers in Terraform. Then opt Flex jobs in:
runs-on: runs-on=${{ github.run_id }}/runner=2cpu-linux-x64/extras=otelOn Fleet, add otel to the runner’s extras in Terraform. Every fleet using that runner gets it, because Fleet jobs can’t add extras per job.
The workflow never sees your backend URL, but the ingestion header is provisioned to the runner, where workflow steps can read it. Use a write-only ingestion token. The receiver only speaks OTLP over HTTP on the host’s loopback interface: no gRPC, and a job container: can’t reach it without host networking.
Runner export also sends host metrics every 15 seconds and the bootstrap log. The OpenTelemetry reference lists every signal and setting, and the local collector guide has more workflow examples.
Start with the automatic spans to find the slow step. Then name the work inside it. In our case, the answer wasn’t in the tests at all.