Send RunsOn telemetry to Pydantic Logfire
Logfire now has a RunsOn integration: point your stack at it and get dashboards for jobs, queue times, Spot interruptions, cost, and runner usage.
 Cyril Rohr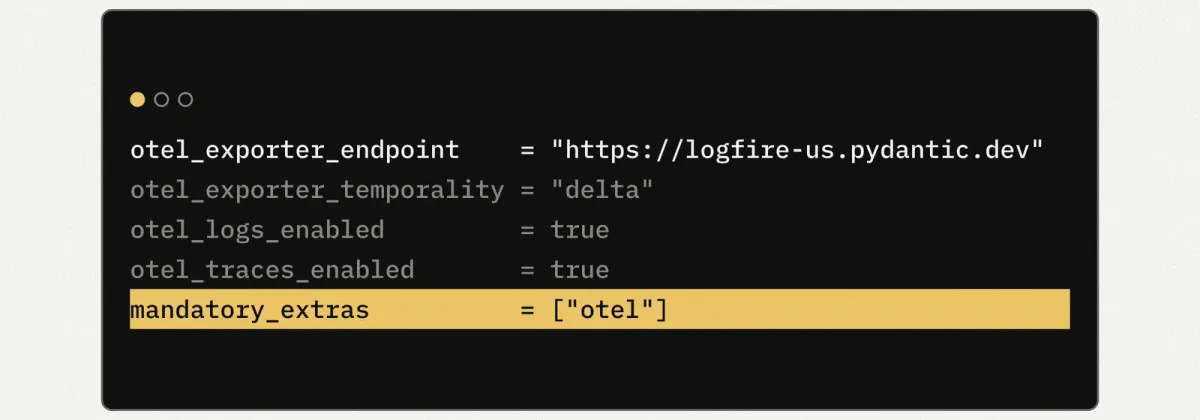
Pydantic Logfire ↗ now has a RunsOn integration. If you already use Logfire, you can point your RunsOn stack at it and get dashboards for your CI in a few minutes.
The Logfire team built it while moving Pydantic’s own CI to RunsOn ↗. Their CI bill went from $18.2k in August to $5.7k in September, while runner minutes grew 31%. To right-size runners at that scale, you need to see what each job actually uses. RunsOn already exported OpenTelemetry from its control plane and runners, and Logfire accepts OTLP, so the integration is mostly dashboards on top.
Setup#
It is opt-in: nothing goes to Logfire until you point your stack at it. On a RunsOn v3.4.0 or later stack, this is the whole setup in Terraform:
otel_exporter_endpoint = "https://logfire-us.pydantic.dev"otel_exporter_headers = "authorization=Bearer ${var.logfire_write_token}"otel_exporter_temporality = "delta"otel_logs_enabled = trueotel_traces_enabled = truemandatory_extras = ["otel"]The first five lines send the control plane’s metrics, logs, and traces. mandatory_extras turns on runner metrics for every job, without touching a single workflow. CloudFormation stacks take the endpoint, header, and temporality as stack parameters, and add extras=otel to the jobs they want runner metrics for.
Use a send-only Logfire key. Workflow steps on runners with otel can read it.
What you get#
Install the RunsOn integration in your Logfire project. You get two dashboards:
- RunsOn Operations: jobs waiting for a runner, launch failures, Spot interruptions, outcomes, capacity, and estimated cost per job.
- RunsOn Runner Resources: CPU, memory, disk, and network per workflow, so you can see which jobs run on twice the machine they need.
It also comes with alert templates. The one for missing telemetry is on by default, the others (Spot circuit breaker, provisioning failures, pool errors, cost-estimate coverage) are yours to turn on.
The full setup, with the EU endpoint, Fleet, and troubleshooting, is in the Logfire guide.
Where I would start#
Turn on runner metrics everywhere, let it run for a week, then open Runner Resources and sort by workflow. The jobs sitting at 20% CPU on 8 vCPU are where your bill goes down. If you are not on RunsOn yet, it pays for itself from about 22 jobs a day.