Job Metrics
Monitor job performance and resource usage
Metadata
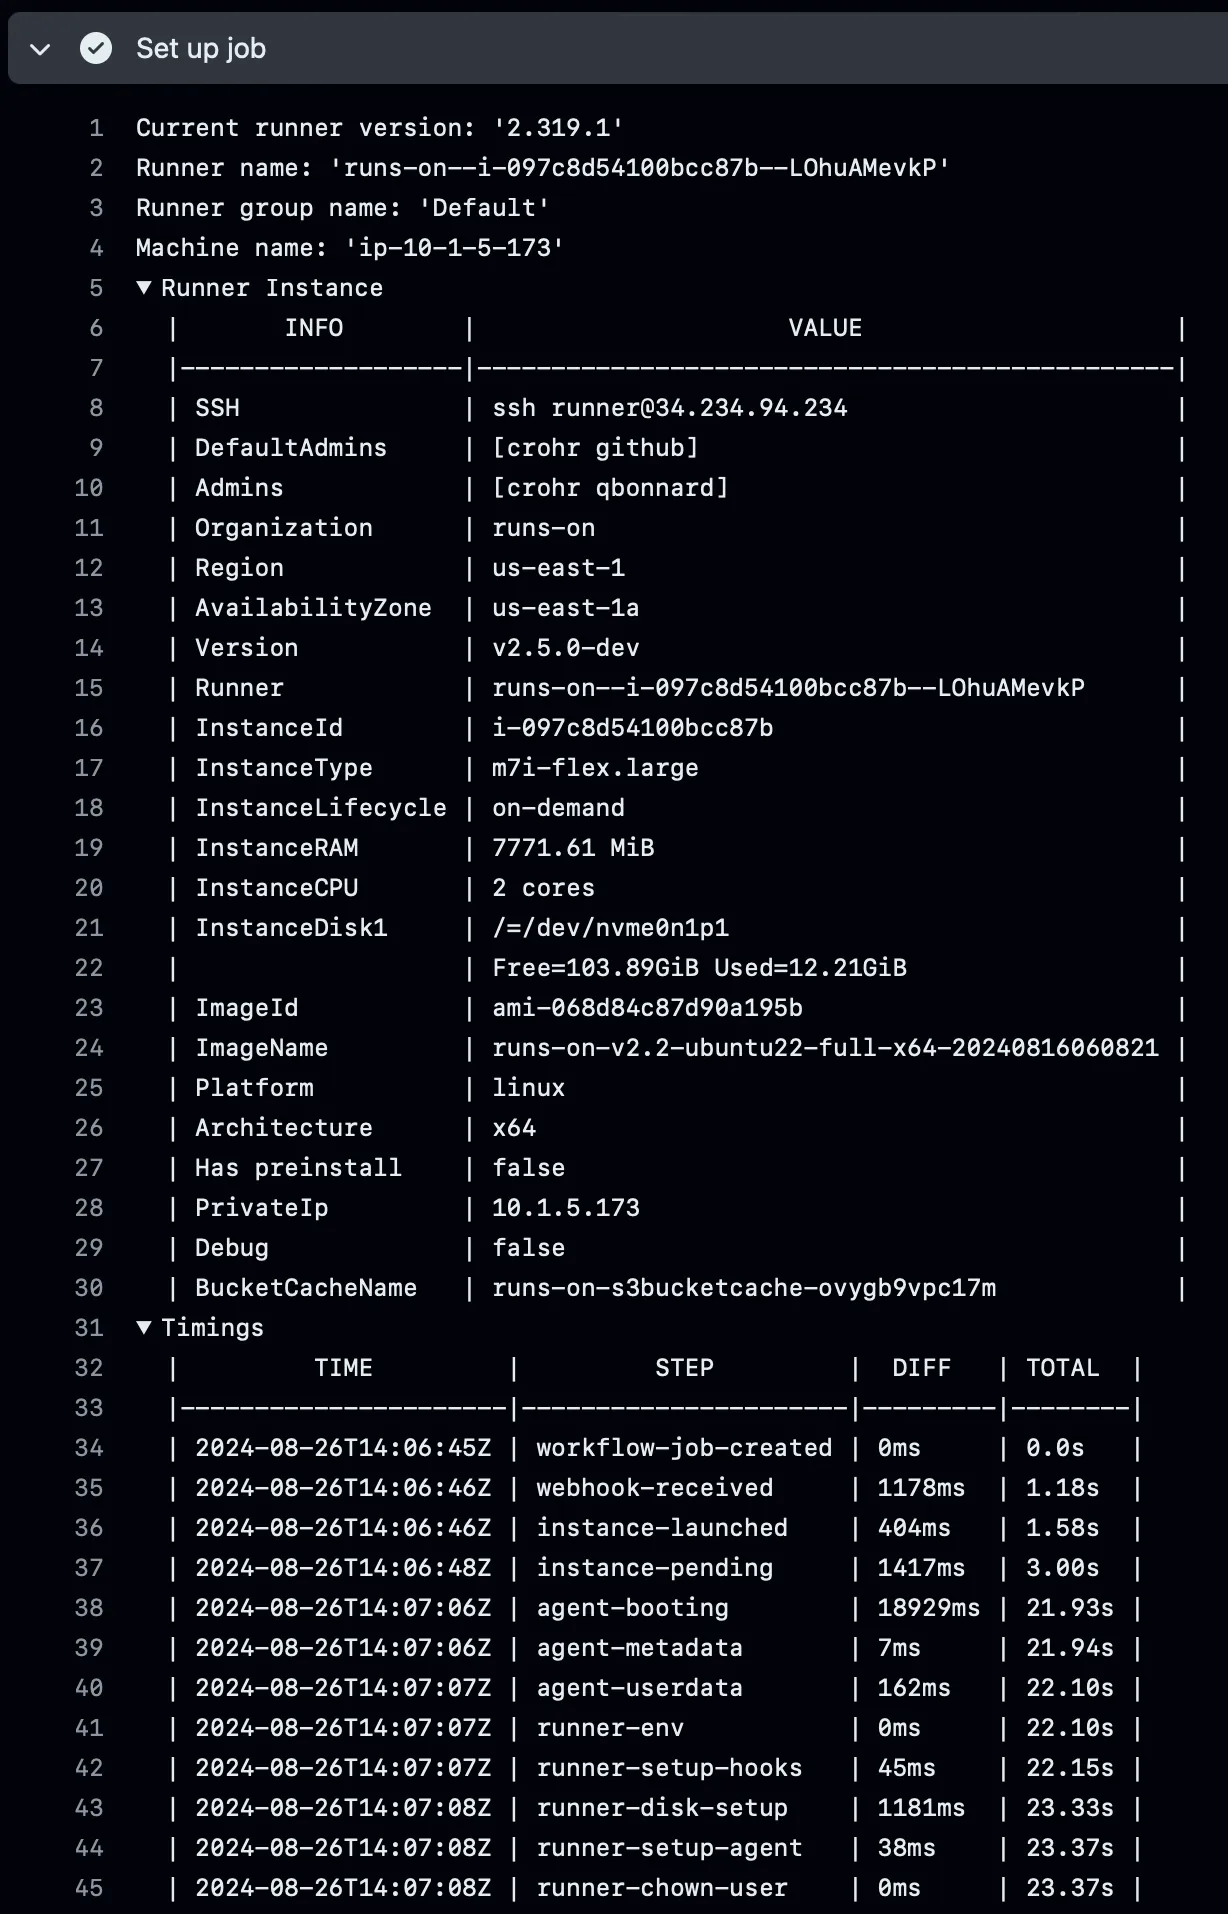
Section titled “Metadata”For each runner, you will also find detailed metrics about the EC2 instance, RunsOn installation, and runner timings. This is available when you expand the “Set up job” section in the GitHub Actions UI:
Performance Metrics
Section titled “Performance Metrics”The runs-on/action@v2 ↗ provides real-time performance metrics collection for individual GitHub Actions jobs. These metrics give you detailed insights into resource utilization during workflow execution.
The way it works is to automatically configure the CloudWatch agent on the instance to collect additional custom metrics, and then display them in the GitHub Actions job summary. Note that CloudWatch custom metrics are not cheap, so make sure you only enable metric collection while troubleshooting. Also the more metrics you collect, the more expensive it will be.
Supported Metrics
Section titled “Supported Metrics”The action can collect the following performance metrics:
| Metric Type | Available Metrics | Description |
|---|---|---|
| CPU | usage_user, usage_system | CPU utilization by user processes and system processes |
| Network | bytes_recv, bytes_sent | Network traffic in bytes received and sent |
| Memory | used_percent | Memory utilization as a percentage |
| Disk | used_percent, inodes_used | Disk space utilization and inode usage |
| I/O | io_time, reads, writes | Disk I/O time and read/write operations |
Configuration
Section titled “Configuration”Enable metrics collection by adding the runs-on/action@v2 to your job and specifying which metrics to collect:
jobs:  build:    runs-on: runs-on=${{ github.run_id }}/runner=2cpu-linux-x64    steps:      - uses: runs-on/action@v2        with:          metrics: cpu,network,memory,disk,io
      # Your build steps here      - uses: actions/checkout@v6      - name: Build application        run: npm run build
You can also collect specific metric types:
# Collect only CPU and memory metrics- uses: runs-on/action@v2  with:    metrics: cpu,memory
# Collect all available metrics- uses: runs-on/action@v2  with:    metrics: cpu,network,memory,disk,io
Viewing Metrics
Section titled “Viewing Metrics”After job completion, metrics are displayed as ASCII charts in the GitHub Actions job summary:
📈 Metrics (since 2025-06-30T14:18:56Z):

📊 CPU User:   100.0 ┤    87.5 ┤                                        ╭─╮╭───────────╮    75.0 ┤                                       ╭╯ ╰╯           │    62.5 ┤                                      ╭╯               ╰╮    50.0 ┤                                      │                 │    37.5 ┤                                      │                 ╰╮    25.0 ┤                                     ╭╯                  │    12.5 ┤                    ╭─────────╮╭─────╯                   ╰╮     0.0 ┼────────────────────╯         ╰╯                          ╰                               CPU User (Percent)  Stats: min:0.0 avg:29.0 max:93.4 Percent

📊 Memory Used:   100.0 ┤    87.5 ┤    75.0 ┤    62.5 ┤    50.0 ┤    37.5 ┤    25.0 ┤                                             ╭────────╮    12.5 ┤                            ╭──╮      ╭──────╯        ╰───╮     0.0 ┼────────────────────────────╯  ╰──────╯                   ╰                             Memory Used (Percent)  Stats: min:0.5 avg:7.4 max:20.9 Percent
The metrics help you:
- Optimize Resource Usage: Identify whether your runner size is appropriate
- Debug Performance Issues: Spot bottlenecks in CPU, memory, disk I/O, or network
- Cost Optimization: Right-size your runners based on actual resource consumption
- Monitor Trends: Track performance changes across builds
You can also find the metrics in the CloudWatch UI and API, under the CWAgent namespace.
Use Cases
Section titled “Use Cases”Resource Right-sizing:
# Test different runner sizes with metricsstrategy: matrix: runner: - runs-on=${{ github.run_id }}/family=m7a/cpu=2 - runs-on=${{ github.run_id }}/family=m7a/cpu=4 - runs-on=${{ github.run_id }}/family=m7a/cpu=8runs-on: ${{ matrix.runner }}steps: - uses: runs-on/action@v2 with: metrics: cpu,memory,disk,io - name: Run build run: | # Your build commands go build ...Performance Debugging:
# Monitor resource usage during heavy operations- uses: runs-on/action@v2 with: metrics: cpu,memory,disk,io- name: Run resource-intensive build run: | # Your build commands npm run build:prod docker build -t app .