OpenTelemetry
Per-job runner metrics in the GitHub Actions UI, plus the exact OTLP signal behavior RunsOn exports server- and runner-side.
This page covers RunsOn metrics end to end: the per-job runner metrics you get in the GitHub Actions UI, and the authoritative OpenTelemetry reference for Flex and Fleet — what each product emits, when, and where the automatic behavior stops.
At a glance#
RunsOn surfaces per-job resource metrics (CPU, memory, disk, network, I/O) through three paths, from zero-config inline charts to full OTLP export. Server-side control-plane signals go out over OTLP only.
| Path | Where it appears | Setup | Best for |
|---|---|---|---|
| Built-in inline charts | Complete runner step + metrics.jsonl in S3 | None — on by default | Default rightsizing and single-job troubleshooting |
runs-on/action@v2 CloudWatch | Post Run runs-on/action@v2 step | Add the action with metrics: | AWS-native per-job metrics — see CloudWatch |
| Runner OTLP export | Your OTLP backend | OTEL runner extra + stack OTLP endpoint | Long-term runner-host observability |
These are not mutually exclusive — a job can render inline charts and export to OTLP at the same time.
Per-job runner metrics#
Use these to rightsize runners and spot job-level constraints without leaving the GitHub Actions UI.
Built-in inline charts#
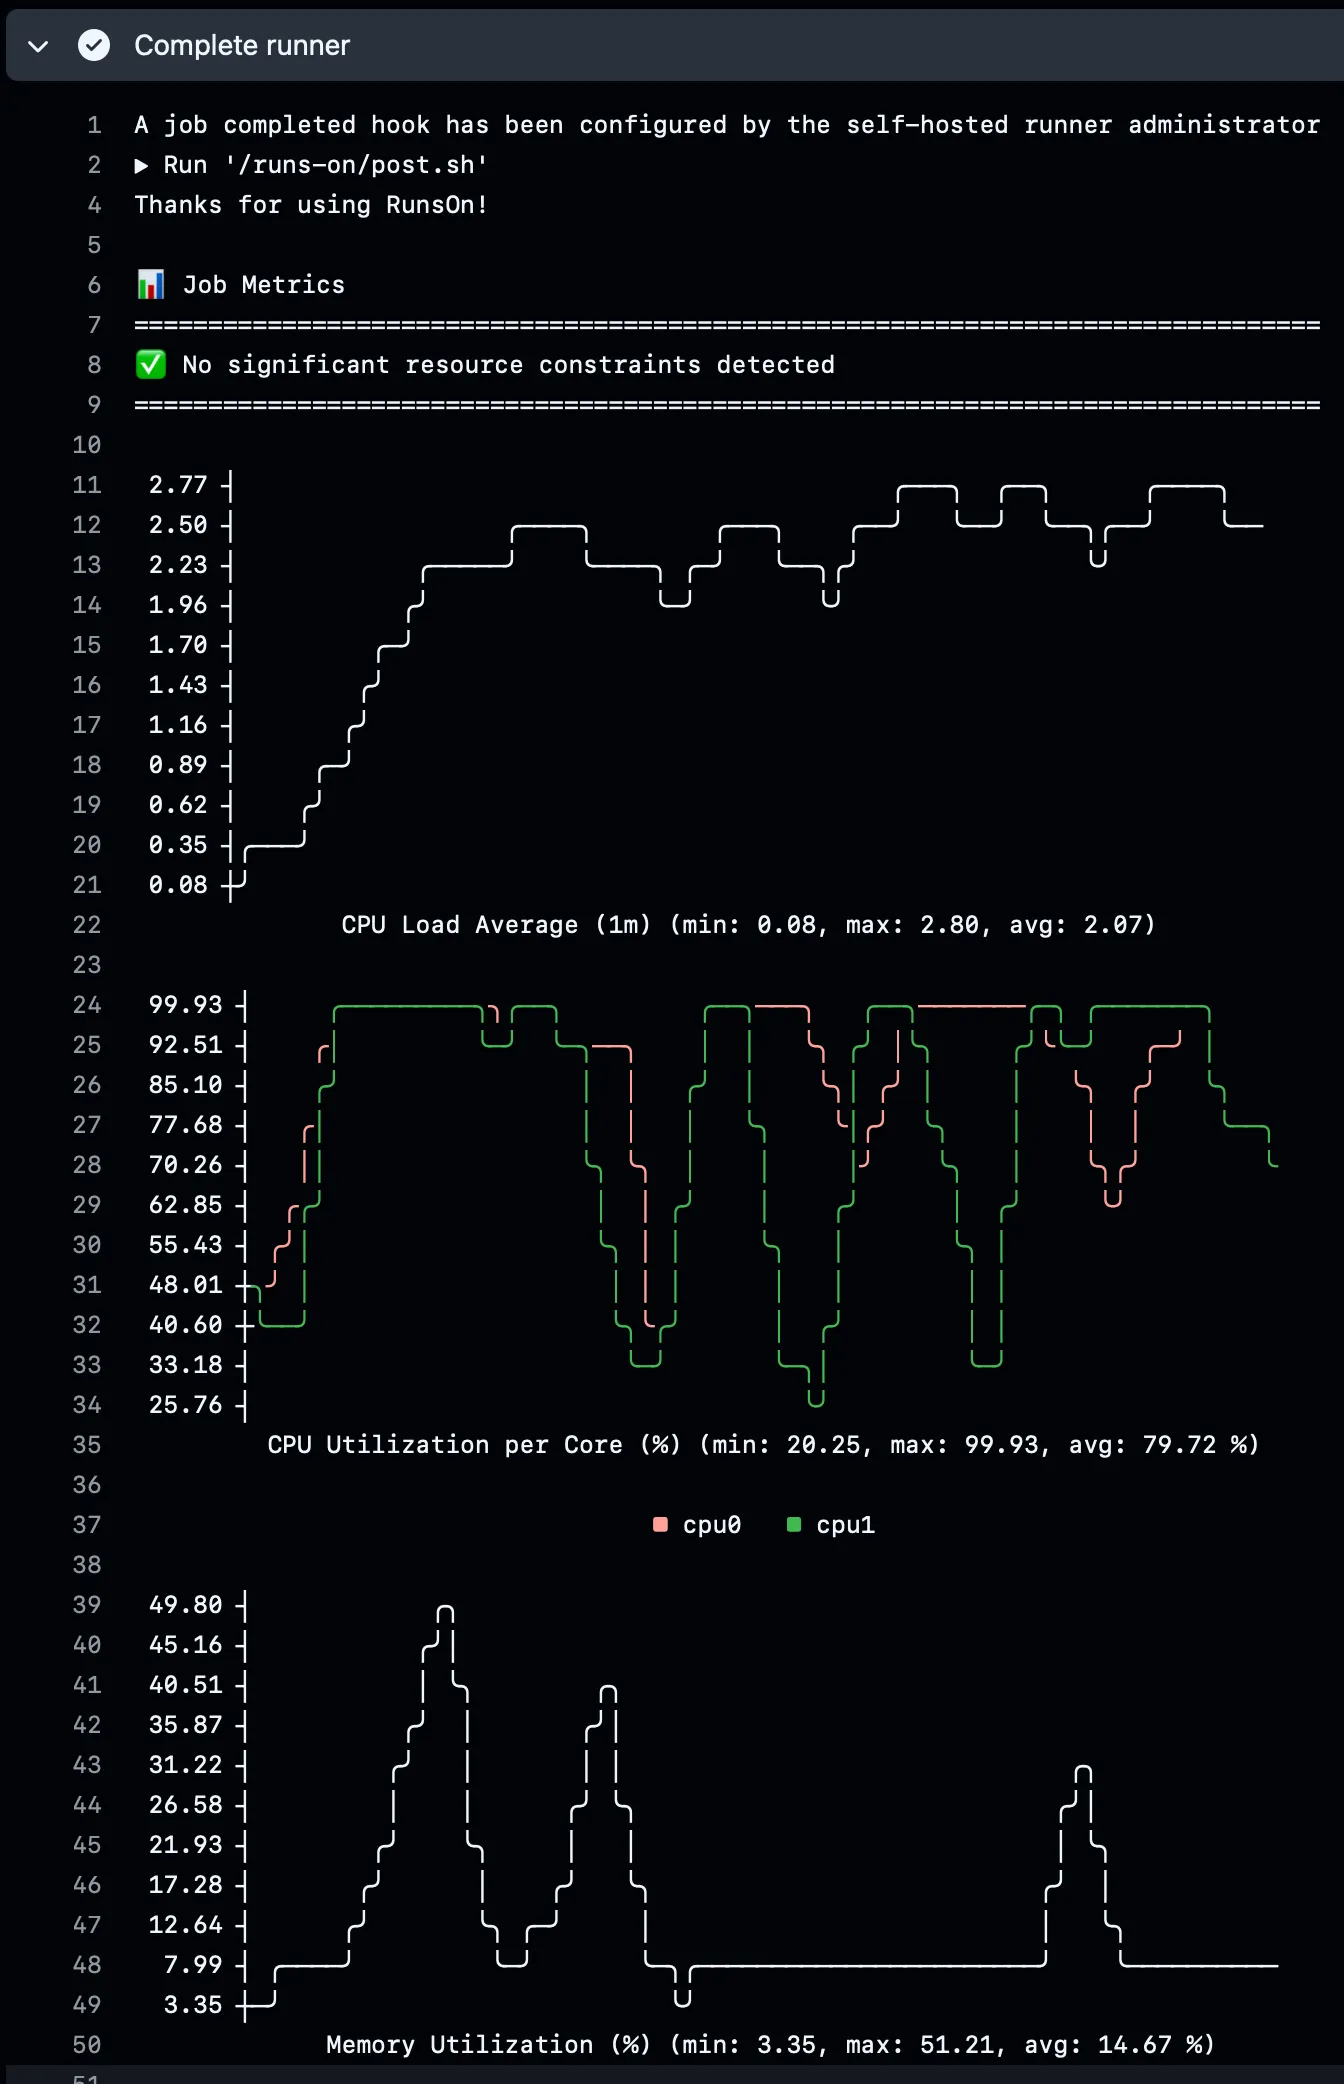
This is the default path on current RunsOn runners:
- The runner collects local host metrics during the job.
- RunsOn writes those samples into
metrics.jsonlon the runner. - The
Complete runnerstep renders ASCII charts from that file. - The same step uploads
metrics.jsonlinto your RunsOn S3 bucket for later inspection.
This flow is separate from remote OTLP export — you get the Complete runner charts and the uploaded metrics.jsonl file without enabling extras=otel.
Runner metadata#
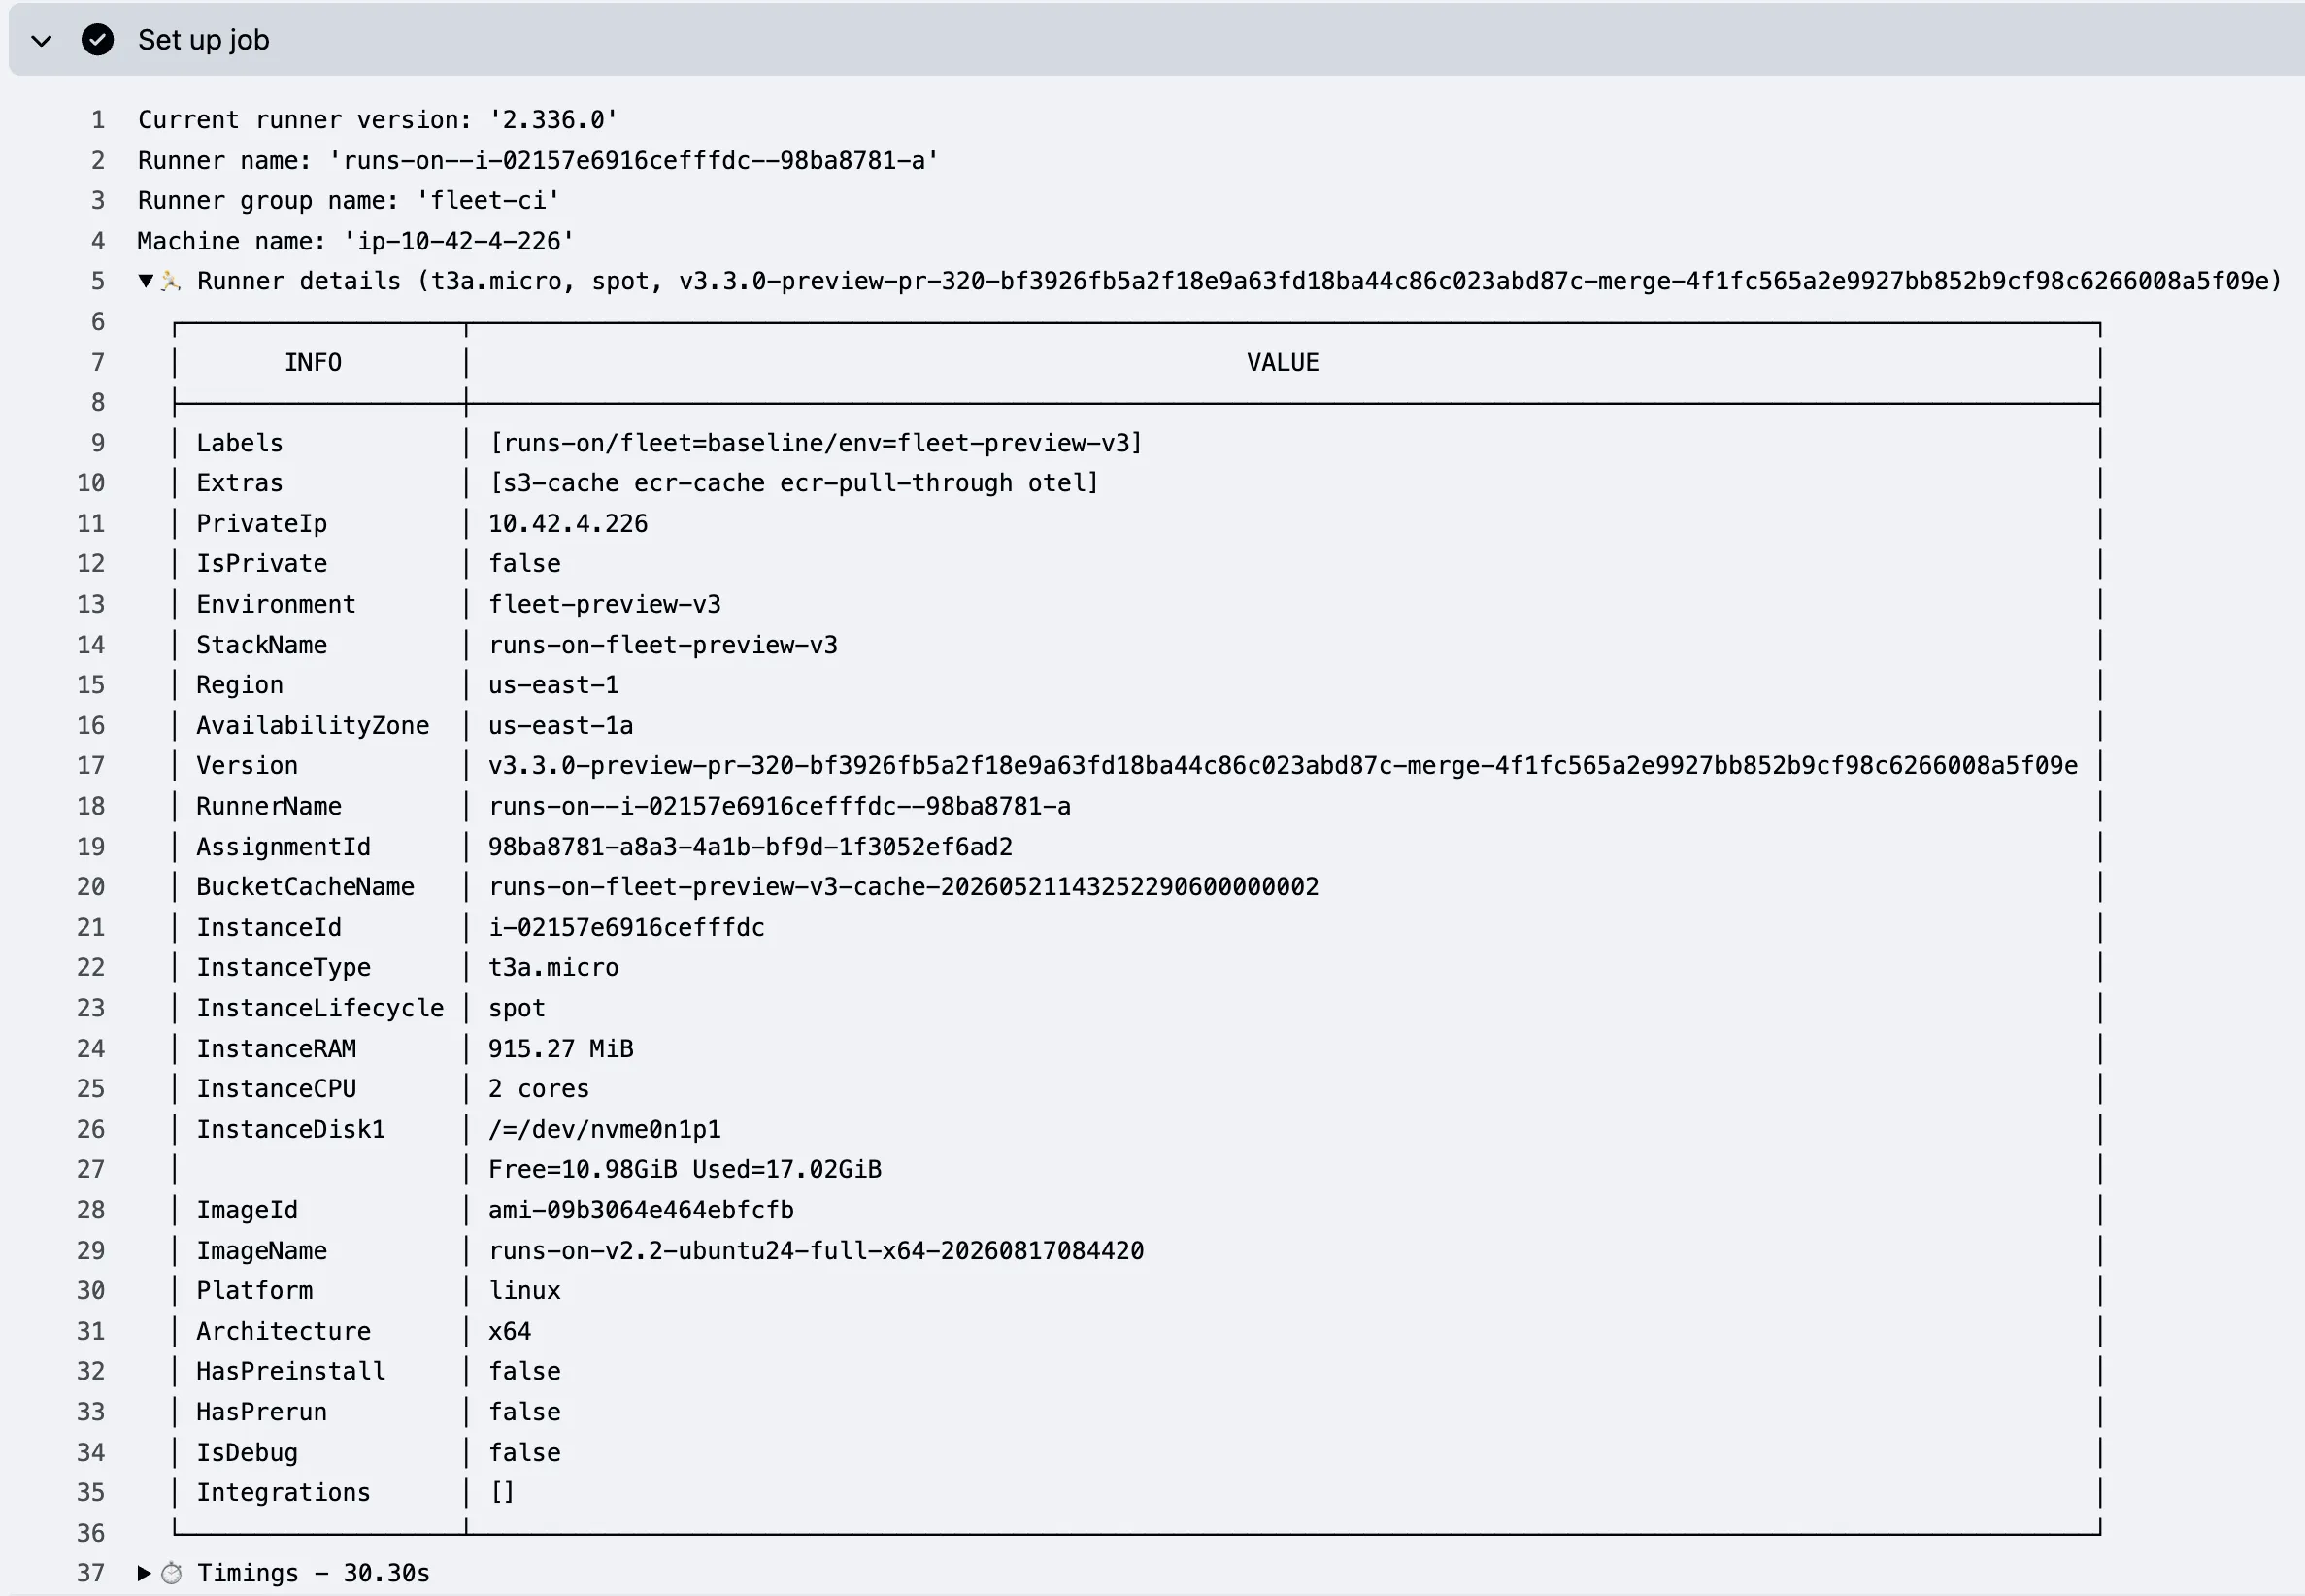
Each job log separates static runner details from the identity of the assigned job:
Expand Set up job for the EC2 instance, RunsOn installation, and provisioning timings.
Set up jobExpand Set up runner, then Job identity, for the organization, repository, workflow, and job ID.
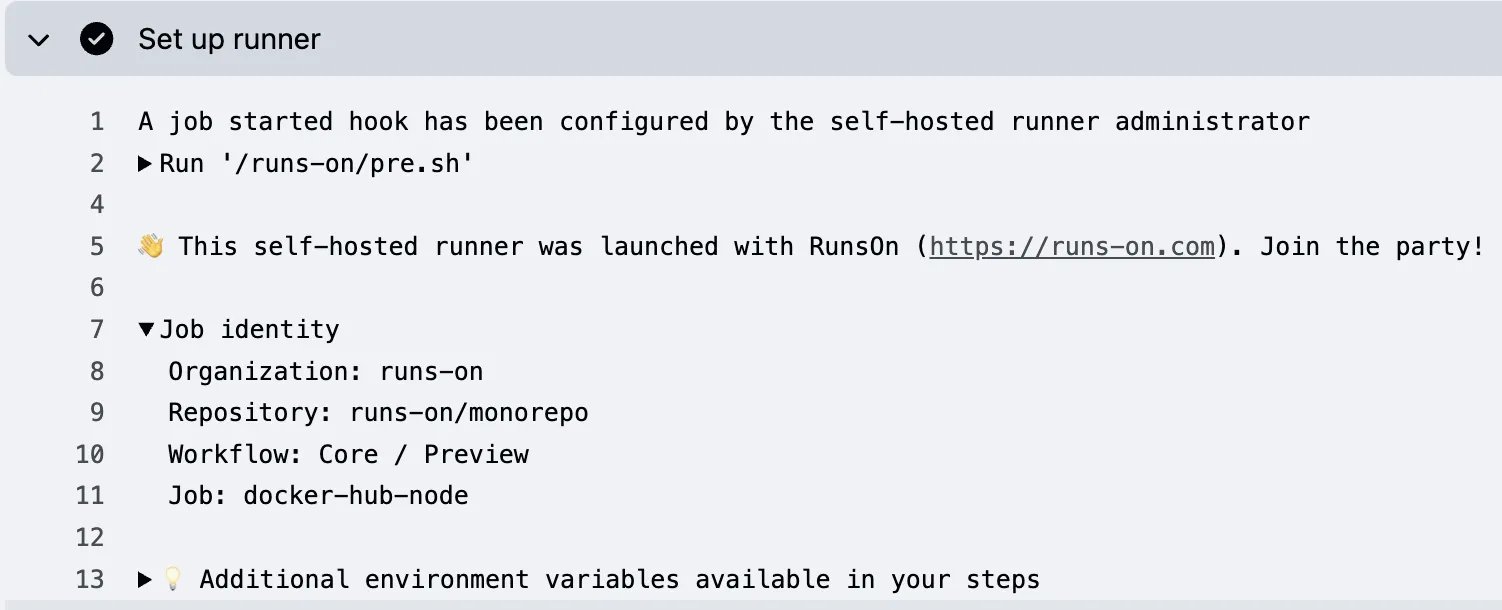
Set up runnerRunsOn writes the job identity when the job starts. This keeps the values accurate when Fleet pre-provisions capacity before GitHub assigns a job.
Control-plane behavior#
When an OTLP endpoint is configured, Flex and Fleet export OTLP logs, metrics, and traces from their control planes. Flex uses service.name=runs-on-flex; Fleet uses service.name=runs-on-fleet. Both emit the unified RunsOn server-metrics catalog below, structured operator logs, and Go runtime metrics.
Current v3 installs do not expose a Prometheus /metrics endpoint. Use the
product’s OTLP endpoint setting for server-side metrics: OtelExporterEndpoint
for Flex CloudFormation, or otel_exporter_endpoint for Flex and Fleet
Terraform.
Runner-side behavior#
Runner-side OTEL behavior is available on Flex starting with RunsOn v2.12.0. Fleet uses the same runner exporter starting with RunsOn v3.2.0.
When the stack has an OTLP endpoint configured and runner OTEL is enabled, the runner exports its host metrics (CPU load and utilization, memory, disk I/O, network I/O) to your observability backend. It also exports bootstrap logs when otel_logs_enabled is true and agent and job spans when otel_traces_enabled is true.
The collector also exposes an OTLP/HTTP receiver on 127.0.0.1:4318 for
programs running inside the workflow. See Local OpenTelemetry
collector for otel-cli and
CargoWall examples.
On Flex, add extras=otel to a job label or to the runner spec used by a pool:
runs-on: runs-on=${{ github.run_id }}/runner=2cpu-linux-x64/extras=otelOn Fleet, add otel to the runner’s extras in Terraform. Every fleet that references this runner gets runner-side OTLP export:
runners = { linux-small = { # ... extras = ["otel"] }}- The collector always writes local
metrics.jsonlfor the built-in inline charts, independent of OTLP — enabling one does not require the other. - Remote OTLP export only happens when the runner has OTEL enabled and the stack OTLP endpoint is configured.
- RunsOn exports the same core runner host-metric set on Linux and Windows, with platform-specific device and mount filtering.
- Fleet workflows cannot add extras per job. Configure
extras = ["otel"]on the Fleet runner definition instead.
Datadog resource attributes as tags#
RunsOn adds runner identity and context as OTLP resource attributes, including service.instance.id, stack_name, region, org, instance_type, and repo_full_name. When exporting directly to Datadog’s OTLP endpoint, ask Datadog to promote those resource attributes into metric tags:
otel_exporter_temporality = "delta"otel_exporter_headers = "dd-api-key=<dd-key>,dd-otel-metric-config=${jsonencode({ resource_attributes_as_tags = true })}"OtelExporterTemporality: deltaOtelExporterHeaders: dd-api-key=<dd-key>,dd-otel-metric-config={"resource_attributes_as_tags":true}Without resource_attributes_as_tags, Datadog can receive the metrics while hiding useful runner context such as the EC2 instance id from metric tag filters.
Logs#
When the stack OTLP endpoint is configured, RunsOn exports control-plane logs from Flex or Fleet. Terraform enables log export by default through otel_logs_enabled; logs also remain available in CloudWatch through the usual AWS log groups.
RunsOn forwards the runner bootstrap log file (output.log) through the local collector when runner OTEL is enabled.
This is the RunsOn bootstrap and agent log path. It is not the full GitHub workflow job log stream.
If the EC2 instance log group is configured, the same bootstrap log file also remains available through the instance log group path in CloudWatch.
Traces#
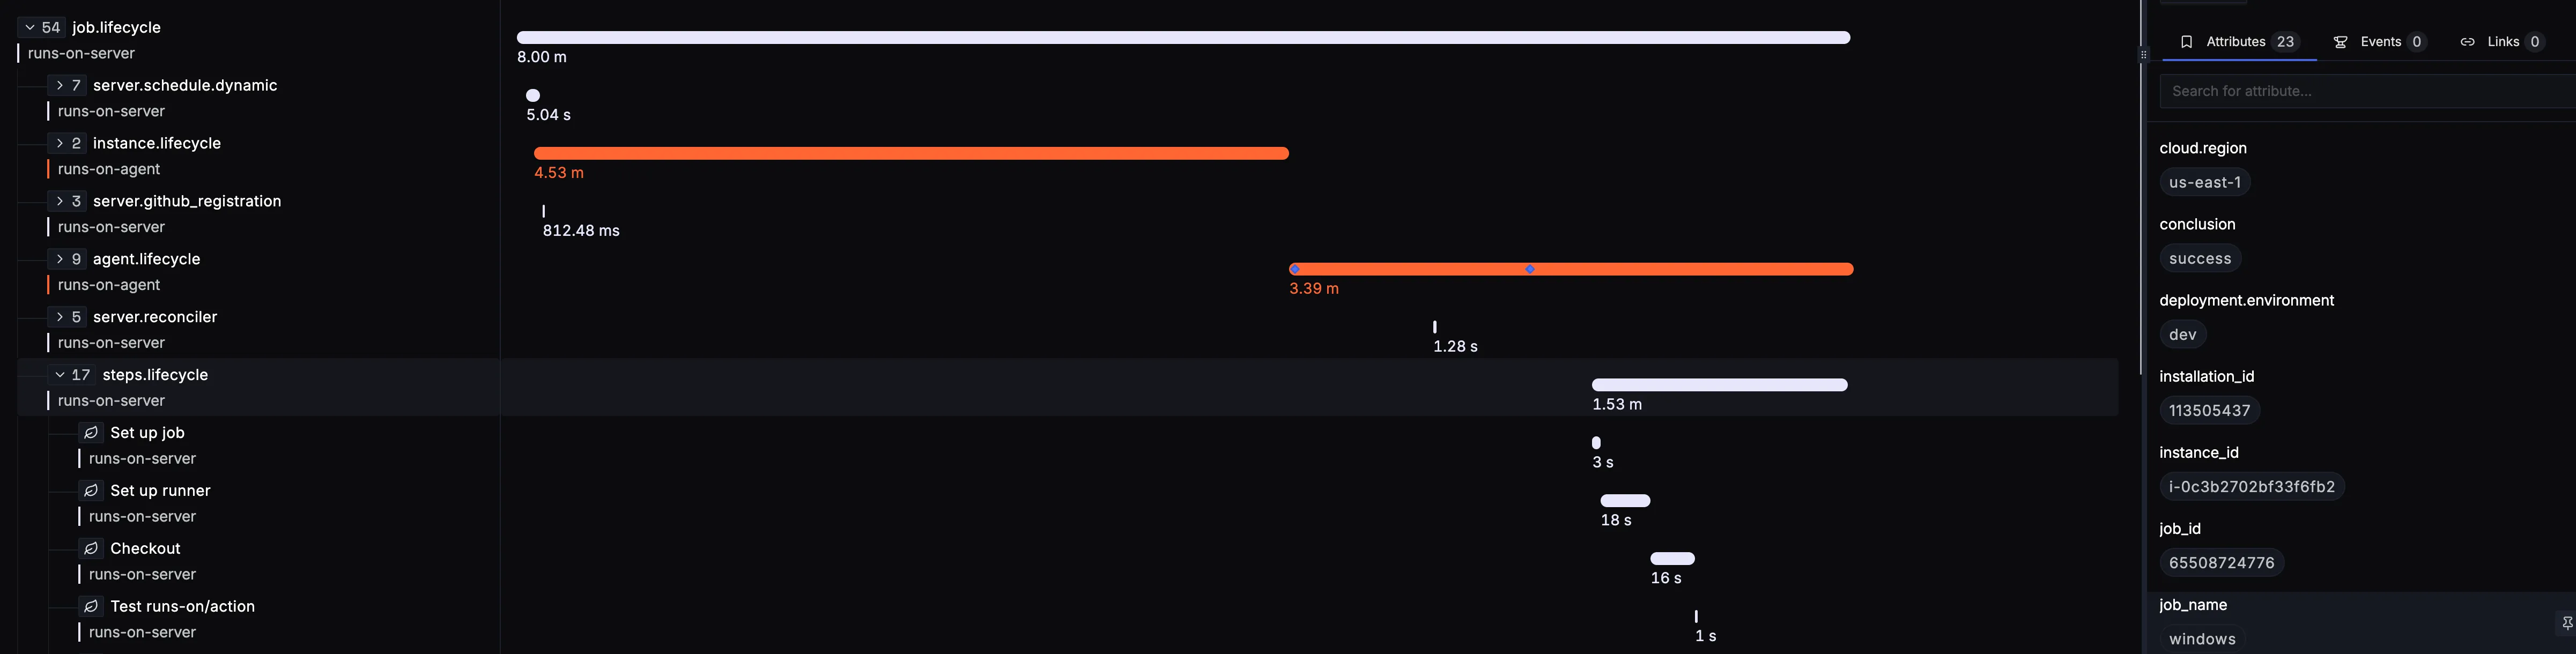
RunsOn emits control-plane traces plus agent and instance lifecycle traces. Terraform enables control-plane trace export by default through otel_traces_enabled.
Flex also emits per-step job spans automatically after a job completes. Those spans are emitted from the Flex control plane, and you don’t need to set extras=otel on jobs to get them.
v3.2 operator telemetry#
v3.2 gives Flex and Fleet one operator metric and structured-event contract. Configure the control-plane exporter on either Terraform module with the same inputs:
otel_exporter_endpoint = "https://your-otlp-endpoint"otel_exporter_headers = "authorization=<token>"otel_exporter_temporality = "cumulative"otel_logs_enabled = trueotel_traces_enabled = trueUse the authentication header format required by your backend, and keep it in your normal secret-management path. For a Flex CloudFormation stack, use OtelExporterEndpoint, OtelExporterHeaders, and OtelExporterTemporality instead.
Update existing dashboards and alerts#
Update queries that use the previous Flex-only contract:
| Previous query | v3.2 query or behavior |
|---|---|
service.name = runs-on-server | Flex is runs-on-flex; Fleet is runs-on-fleet. Include both values in shared dashboards. |
runs_on_pool_instances_total | runs_on_pool_instances |
runs_on_provisioning_registration_retries_total | runs_on_provisioning_retries_total, filtered by provisioning_stage |
runs_on_launch_failures_total | runs_on_provisioning_failures_total, filtered by provisioning_stage, error_code, and instance_lifecycle |
runs_on_jobs_queue_fetched or runs_on_scaling_boost_active | Removed. Use the current queue, runner, and provisioning metrics below. |
metric_type=snapshot | metric_type=operator_snapshot |
metric_type=job_event | Removed. Use job_launched and job_summary. |
CloudWatch RunsOn/minutes metrics | Removed. Use runs_on_jobs_total over OTLP, or count job_launched and job_summary structured logs. |
The first Fleet maintenance pass after rollout can replay one in-flight lifecycle event from an older claim. Structured events have deterministic event_id values for deduplication; OTLP job counters can show a one-time bump.
Cost estimates and structured events#
runs_on_job_estimated_cost_usd is an operational estimate, not an AWS bill. It includes EC2 compute plus live root and sticky EBS usage. Retained sticky snapshots are exported separately as runs_on_sticky_snapshot_estimated_cost_usd_per_hour; that value is an hourly upper bound based on full volume size, while AWS bills only changed EBS blocks.
If pricing or durable launch inputs are incomplete, RunsOn omits a cost estimate rather than recording zero. Use runs_on_job_cost_estimate_coverage and runs_on_pool_cost_estimate_coverage before treating cost charts as representative.
For a ready-made Flex and Fleet view, import the SigNoz operator dashboard. It uses job_launched, job_summary, operator_snapshot, and spot_interruption alongside the OTLP metrics.
Reference: metric inventory#
RunsOn server metrics#
| Metric | Kind | Unit | Description | Attributes | Transport |
|---|---|---|---|---|---|
runs_on_jobs_total | counter | {job} | Total number of jobs by status. | conclusioninstance_familyinstance_lifecycleinstance_typeinterruptedorgpool_namepool_typeproductreporepo_full_namestatusworkflow_nameworkflow_path | Exported through OTLP metrics when the stack OTLP endpoint is configured. |
runs_on_runner_instances | observable_gauge | {instance} | Current active runner instances by control plane, lifecycle, and state. | fleet_nameinstance_lifecyclepool_nameproductstate | Exported through OTLP metrics when the stack OTLP endpoint is configured. |
runs_on_rate_limiter_waits_total | counter | {wait} | Rate-limiter acquisitions that blocked waiting for capacity or failed; zero-wait fast-path acquisitions are not counted. | limiteroutcome | Exported through OTLP metrics when the stack OTLP endpoint is configured. |
runs_on_rate_limiter_wait_duration_seconds | histogram | s | Time spent waiting for rate-limiter capacity when acquisition blocked or failed. | limiteroutcome | Exported through OTLP metrics when the stack OTLP endpoint is configured. |
runs_on_internal_queue_duration_seconds | histogram | s | Time from the recorded queue reference to runner scheduling. For capacity-backed Fleet claims, fleet_demand_observed is the claim-materialization time, not GitHub’s exact job queue timestamp. | conclusioninstance_familyinstance_lifecycleinterruptedorgpool_nameproductqueue_time_sourcerepostatusworkflow_path | Exported through OTLP metrics when the stack OTLP endpoint is configured. |
runs_on_overall_queue_duration_seconds | histogram | s | Time from the recorded queue reference to job start. queue_time_source distinguishes exact GitHub timestamps from Fleet claim-materialization fallback. | conclusioninstance_familyinstance_lifecycleinterruptedorgpool_nameproductqueue_time_sourcerepostatusworkflow_path | Exported through OTLP metrics when the stack OTLP endpoint is configured. |
runs_on_job_duration_seconds | histogram | s | Time from job started to completed. | conclusioninstance_familyinstance_lifecycleinterruptedorgpool_nameproductrepostatusworkflow_path | Exported through OTLP metrics when the stack OTLP endpoint is configured. |
runs_on_job_end_to_end_duration_seconds | histogram | s | Time from the recorded queue reference to job completion. queue_time_source distinguishes exact GitHub timestamps from Fleet claim-materialization fallback. | conclusioninstance_familyinstance_lifecycleinterruptedorgpool_nameproductqueue_time_sourcerepostatusworkflow_path | Exported through OTLP metrics when the stack OTLP endpoint is configured. |
runs_on_launch_attempts_total | counter | {attempt} | Total EC2 launch attempts attributable to workflow jobs. | conclusioninstance_familyinstance_lifecycleinstance_typeinterruptedorgpool_namepool_typeproductreporepo_full_namestatusworkflow_nameworkflow_path | Exported through OTLP metrics when the stack OTLP endpoint is configured. |
runs_on_job_estimated_cost_usd | histogram | {USD} | Estimated EC2 and EBS cost attributable to a completed job, including provisioned snapshot initialization. | conclusioninstance_familyinstance_lifecycleinterruptedorgpool_nameproductrepostatusworkflow_path | Exported through OTLP metrics when the stack OTLP endpoint is configured. |
runs_on_job_estimated_ec2_cost_usd | histogram | {USD} | Estimated EC2 compute cost attributable to a completed job. | conclusioninstance_familyinstance_lifecycleinterruptedorgpool_nameproductrepostatusworkflow_path | Exported through OTLP metrics when the stack OTLP endpoint is configured. |
runs_on_job_estimated_ebs_cost_usd | histogram | {USD} | Estimated root and sticky EBS volume cost attributable to a completed job, including provisioned snapshot initialization. | conclusioninstance_familyinstance_lifecycleinterruptedorgpool_nameproductrepostatusworkflow_path | Exported through OTLP metrics when the stack OTLP endpoint is configured. |
runs_on_sticky_snapshot_estimated_cost_usd_per_hour | observable_gauge | {USD}/h | Estimated retained sticky snapshot storage cost per hour. Upper bound: sized from the full volume size, while EBS bills only changed blocks. | orgrepoworkflow_path | Exported through OTLP metrics when the stack OTLP endpoint is configured. |
runs_on_job_cost_estimate_coverage | observable_gauge | 1 | Fraction of completed jobs with a complete EC2 and EBS estimate since process start. | - | Exported through OTLP metrics when the stack OTLP endpoint is configured. |
runs_on_pool_estimated_cost_usd_per_hour | observable_gauge | {USD}/h | Estimated current EC2 and root EBS hourly burn rate for pool-owned capacity. State groups are mutually exclusive; completed-job and retained-snapshot costs are separate. | componentfleet_namepool_namestate | Exported through OTLP metrics when the stack OTLP endpoint is configured. |
runs_on_pool_cost_estimate_coverage | observable_gauge | 1 | Fraction of current pool-owned resources with complete pricing inputs for each state and component. | componentfleet_namepool_namestate | Exported through OTLP metrics when the stack OTLP endpoint is configured. |
runs_on_pool_instances | observable_gauge | {instance} | Current number of pool instances by state. | installation_idorgpool_namestate | Exported through OTLP metrics when the stack OTLP endpoint is configured. |
runs_on_github_operation_duration_seconds | histogram | s | GitHub API operation duration per attempt; server-error retries record as separate samples. | github_app_labelgithub_operationoutcome | Exported through OTLP metrics when the stack OTLP endpoint is configured. |
runs_on_rate_limiter_tokens | observable_gauge | {token} | Available tokens in a rate limiter. | limiter | Exported through OTLP metrics when the stack OTLP endpoint is configured. |
runs_on_rate_limiter_burst | observable_gauge | {token} | Burst capacity of a rate limiter. | limiter | Exported through OTLP metrics when the stack OTLP endpoint is configured. |
runs_on_aws_operation_duration_seconds | histogram | s | AWS API operation duration. | aws_operationoutcome | Exported through OTLP metrics when the stack OTLP endpoint is configured. |
runs_on_spot_circuit_breaker_active | observable_gauge | 1 | Whether the spot circuit breaker is active; 1 means active and 0 means inactive. | - | Exported through OTLP metrics when the stack OTLP endpoint is configured. |
runs_on_github_operations_total | counter | {operation} | Total number of GitHub API call attempts by operation name; server-error retries count separately. | github_app_labelgithub_operationoutcome | Exported through OTLP metrics when the stack OTLP endpoint is configured. |
runs_on_aws_operations_total | counter | {operation} | Total number of AWS API operations by operation name. | aws_operationoutcome | Exported through OTLP metrics when the stack OTLP endpoint is configured. |
runs_on_registration_jit_duration_seconds | histogram | s | Time spent generating a GitHub JIT runner configuration. | github_app_label | Exported through OTLP metrics when the stack OTLP endpoint is configured. |
runs_on_reconciler_backlog | observable_gauge | {job} | Current number of jobs waiting to be reconciled. | - | Exported through OTLP metrics when the stack OTLP endpoint is configured. |
runs_on_jobs_awaiting_launch | observable_gauge | {job} | Current jobs awaiting an EC2 launch by bounded scheduling reason. | reason | Exported through OTLP metrics when the stack OTLP endpoint is configured. |
runs_on_provisioning_backlog | observable_gauge | {job} | Current number of provisioning jobs waiting in the launch or registration queue. | provisioning_stage | Exported through OTLP metrics when the stack OTLP endpoint is configured. |
runs_on_provisioning_inflight | observable_gauge | {job} | Current number of provisioning jobs actively being processed in the launch or registration stage. | provisioning_stage | Exported through OTLP metrics when the stack OTLP endpoint is configured. |
runs_on_provisioning_stage_duration_seconds | histogram | s | Wall-clock time spent in a provisioning stage worker pass. | provisioning_stage | Exported through OTLP metrics when the stack OTLP endpoint is configured. |
runs_on_provisioning_retries_total | counter | {retry} | Total number of retryable provisioning attempts by stage. | provisioning_stage | Exported through OTLP metrics when the stack OTLP endpoint is configured. |
runs_on_provisioning_failures_total | counter | {failure} | Total number of provisioning failures by stage and bounded error code. | error_codeinstance_lifecycleprovisioning_stage | Exported through OTLP metrics when the stack OTLP endpoint is configured. |
runs_on_spot_interruptions_total | counter | {interruption} | Total number of EC2 spot interruption notices observed for owned runners. | instance_family | Exported through OTLP metrics when the stack OTLP endpoint is configured. |
runs_on_fleet_desired_runners | observable_gauge | {runner} | Current desired runner count calculated from GitHub assigned Fleet demand. | fleet_name | Exported through OTLP metrics when the stack OTLP endpoint is configured. |
runs_on_fleet_claims | observable_gauge | {claim} | Current Fleet claim counts by bounded lifecycle state. | fleet_namestate | Exported through OTLP metrics when the stack OTLP endpoint is configured. |
Runner host metrics exported to OTLP by default#
Notes:
- Remote OTLP export requires
extras=otel, a configured OTLP endpoint, andJobEnabled=true. - Applies to Linux and Windows.
- On Linux, disk I/O covers detected whole devices, including additional instance-store disks; filesystem utilization covers the root, sticky-disk, and runner tmpfs mount points.
- On Windows, disk I/O covers fixed drive-letter volumes and filesystem utilization covers the root volume. Directory-mounted sticky disks are not exposed by the Windows scrapers.
- Network metrics are limited to the detected primary network interface.
| Metric | Kind | Unit | Description | Attributes |
|---|---|---|---|---|
system.cpu.load_average.15m | gauge | {thread} | Average CPU Load over 15 minutes. | - |
system.cpu.load_average.1m | gauge | {thread} | Average CPU Load over 1 minute. | - |
system.cpu.load_average.5m | gauge | {thread} | Average CPU Load over 5 minutes. | - |
system.cpu.utilization | gauge | 1 | Difference in system.cpu.time since the last measurement per logical CPU, divided by the elapsed time (value in interval [0,1]). | cpustate |
system.disk.io | sum | By | Disk bytes transferred. | devicedirection |
system.disk.operations | sum | {operations} | Disk operations count. | devicedirection |
system.filesystem.utilization | gauge | 1 | Fraction of filesystem bytes used. | devicemodemountpointtype |
system.memory.utilization | gauge | 1 | Percentage of memory bytes in use. | state |
system.network.io | sum | By | The number of bytes transmitted and received. | devicedirection |
Go runtime appendix#
| Metric | Kind | Unit | Description | Attributes | Transport |
|---|---|---|---|---|---|
go.config.gogc | observable_up_down_counter | % | Heap size target percentage configured by the user, otherwise 100. | - | Exported through OTLP metrics when the stack OTLP endpoint is configured. |
go.goroutine.count | observable_up_down_counter | {goroutine} | Count of live goroutines. | - | Exported through OTLP metrics when the stack OTLP endpoint is configured. |
go.memory.allocated | observable_counter | By | Memory allocated to the heap by the application. | - | Exported through OTLP metrics when the stack OTLP endpoint is configured. |
go.memory.allocations | observable_counter | {allocation} | Count of allocations to the heap by the application. | - | Exported through OTLP metrics when the stack OTLP endpoint is configured. |
go.memory.gc.goal | observable_up_down_counter | By | Heap size target for the end of the GC cycle. | - | Exported through OTLP metrics when the stack OTLP endpoint is configured. |
go.memory.limit | observable_up_down_counter | By | Go runtime memory limit configured by the user, if a limit exists. | - | Exported through OTLP metrics when the stack OTLP endpoint is configured. |
go.memory.used | observable_up_down_counter | By | Memory used by the Go runtime. | go.memory.type | Exported through OTLP metrics when the stack OTLP endpoint is configured. |
go.processor.limit | observable_up_down_counter | {thread} | The number of OS threads that can execute user-level Go code simultaneously. | - | Exported through OTLP metrics when the stack OTLP endpoint is configured. |
go.schedule.duration | histogram | s | The time goroutines have spent in the scheduler in a runnable state before actually running. | - | Exported through OTLP metrics when the stack OTLP endpoint is configured. |
Reference: attribute inventory#
RunsOn server metric attributes#
| Context | Attribute | Action | Description |
|---|---|---|---|
aws_operation | AWS API operation name. | ||
component | Estimated cost component: ec2 or ebs. | ||
conclusion | GitHub job conclusion for completed jobs; empty for other states. | ||
error_code | Bounded launch failure code. | ||
fleet_name | Fleet name when applicable. | ||
github_app_label | GitHub app label. | ||
github_operation | GitHub API operation name. | ||
installation_id | GitHub App installation identifier, or 0 for enterprise PAT targets. | ||
instance_family | EC2 instance family derived from the resolved runner instance type. | ||
instance_lifecycle | Runner pricing lifecycle such as spot or on-demand. | ||
instance_type | EC2 instance type when a job has been assigned to a runner. | ||
interrupted | Whether the job was interrupted before completion. | ||
limiter | Rate limiter identifier. | ||
org | GitHub organization name. | ||
outcome | Wait outcome: success or error. | ||
pool_name | Pool name when the job is served from a pool-backed runner. | ||
pool_type | Pool standby type when applicable. | ||
product | RunsOn control plane: flex or fleet. | ||
provisioning_stage | Provisioning stage, either launch or registration. | ||
queue_time_source | Queue reference provenance: github, fleet_demand_observed, or unknown. | ||
reason | Bounded reason the job is awaiting a launch. | ||
repo | GitHub repository name without its owner. | ||
repo_full_name | Repository full name in owner/repo form. | ||
state | Bounded runner lifecycle state. | ||
status | Job lifecycle status: queued, launched, in_progress, or completed. | ||
workflow_name | GitHub workflow display name. | ||
workflow_path | Canonical GitHub workflow file path. |
RunsOn server resource attributes#
| Context | Attribute | Action | Description |
|---|---|---|---|
cloud.region | AWS region when configured. | ||
deployment.environment | Stack environment name when configured. | ||
service.instance.id | Server host identifier when the hostname can be resolved. | ||
service.name | runs-on-flex for flexd, runs-on-fleet for fleetd, and runs-on-server only when no daemon-specific service name is configured. | ||
service.namespace | Stack name when configured. | ||
service.version | RunsOn app version when configured. |
Runner metric attributes exported to OTLP by default#
| Context | Attribute | Action | Description |
|---|---|---|---|
cpu | cpu | Logical CPU number starting at 0. | |
cpu | state | Breakdown of CPU usage by type. | |
disk | device | Name of the disk. | |
disk | direction | Direction of flow of bytes/operations (read or write). | |
filesystem | device | Identifier of the filesystem. | |
filesystem | mode | Mountpoint mode such “ro”, “rw”, etc. | |
filesystem | mountpoint | Mountpoint path. | |
filesystem | type | Filesystem type, such as, “ext4”, “tmpfs”, etc. | |
memory | state | Breakdown of memory usage by type. | |
network | device | Name of the network interface. | |
network | direction | Direction of flow of bytes/operations (receive or transmit). |
Runner resource attributes#
| Context | Attribute | Action | Description |
|---|---|---|---|
service.name | insert | Inserted as runs-on-agent when the incoming telemetry does not already define a service name. | |
service.namespace | insert | Inserted as runs-on for runner-generated telemetry when the incoming telemetry does not already define a service namespace. | |
service.instance.id | insert | EC2 instance identifier. | |
deployment.environment | upsert | Configured RunsOn environment name. | |
deployment.environment.name | upsert | Configured RunsOn environment name. | |
stack_name | upsert | RunsOn stack name. | |
region | upsert | AWS region. | |
org | upsert | GitHub organization name. | |
instance_type | upsert | EC2 instance type. | |
instance_lifecycle | upsert | EC2 pricing lifecycle such as spot or on-demand. | |
availability_zone | upsert | EC2 availability zone. | |
ami_id | upsert | AMI identifier used by the runner instance. | |
pool_name | upsert | Pool name when the runner comes from a pool. | |
pool_type | upsert | Pool standby type when the runner comes from a pool. | |
repo_full_name | upsert | Repository full name in owner/repo form. | |
workflow_path | upsert | GitHub workflow file path. | |
job_name | upsert | GitHub job name. |
Go runtime metric attributes#
| Context | Attribute | Action | Description |
|---|---|---|---|
go-runtime | go.memory.type | Type of Go runtime memory, currently stack or other. |